
Improve your Influence as a Data Scientist - Part 1

Introduction
I truly believe a Data Scientists’ ultimate level of success is how well they can influence the business through their insights. I define an influencer as a person who can connect and engage with their audience, ultimately helping their audience reach the same data-driven conclusions you have to drive the business.
Yes, there are some Data Scientist roles out there that are more engineering-focused where output are models, however this article focuses on an influencer-focused role. Besides wielding political influence, influence is wielded through presentations.
Two Styles
For data-driven presentations, I’ve witnessed two main styles: Funnel Down and Funnel Up. Imagine a presentation is composed of a series of thoughts and insights. Furthermore, thoughts can be composed of a chain of information, where one piece of information leads to another piece of information until a complete thought is formed. The entire chain of information represents a complete thought from beginning to end:
A Thought:
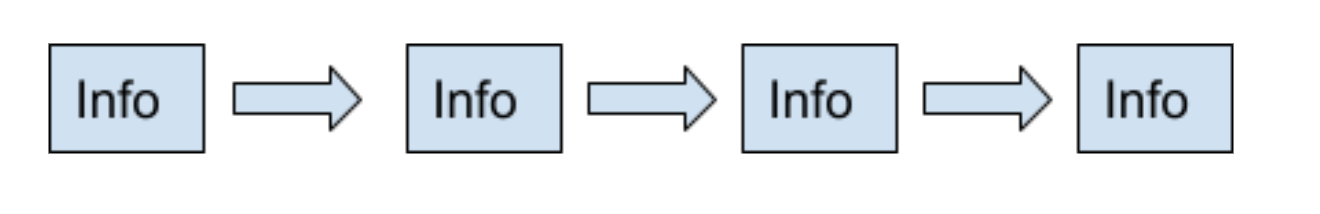
Assume each slide during a presentation represents a complete thought or insight. For each slide, we often see that the first few blocks of information present many details that ultimately lead to the conclusion of the thought.
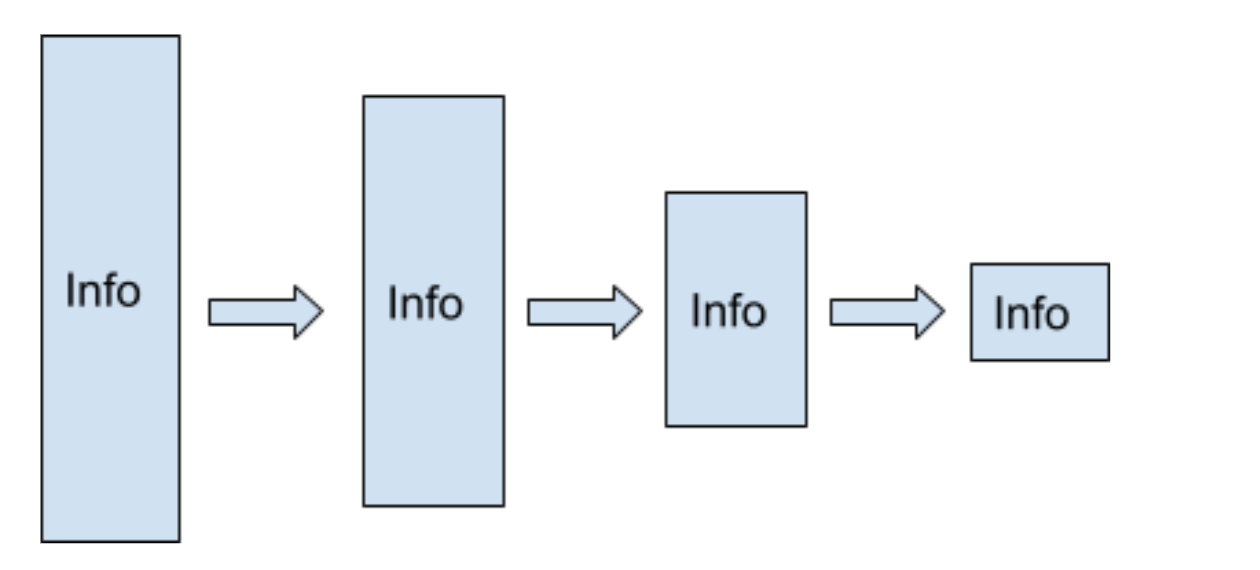
The more detailed information we have, the bigger the height of each box gets as you can see below:
A Thought:
Now let’s flip this image 90 degrees to see that the overall shape looks like a funnel where we have to fall down the funnel to get through to the complete thought, otherwise known as the conclusion.
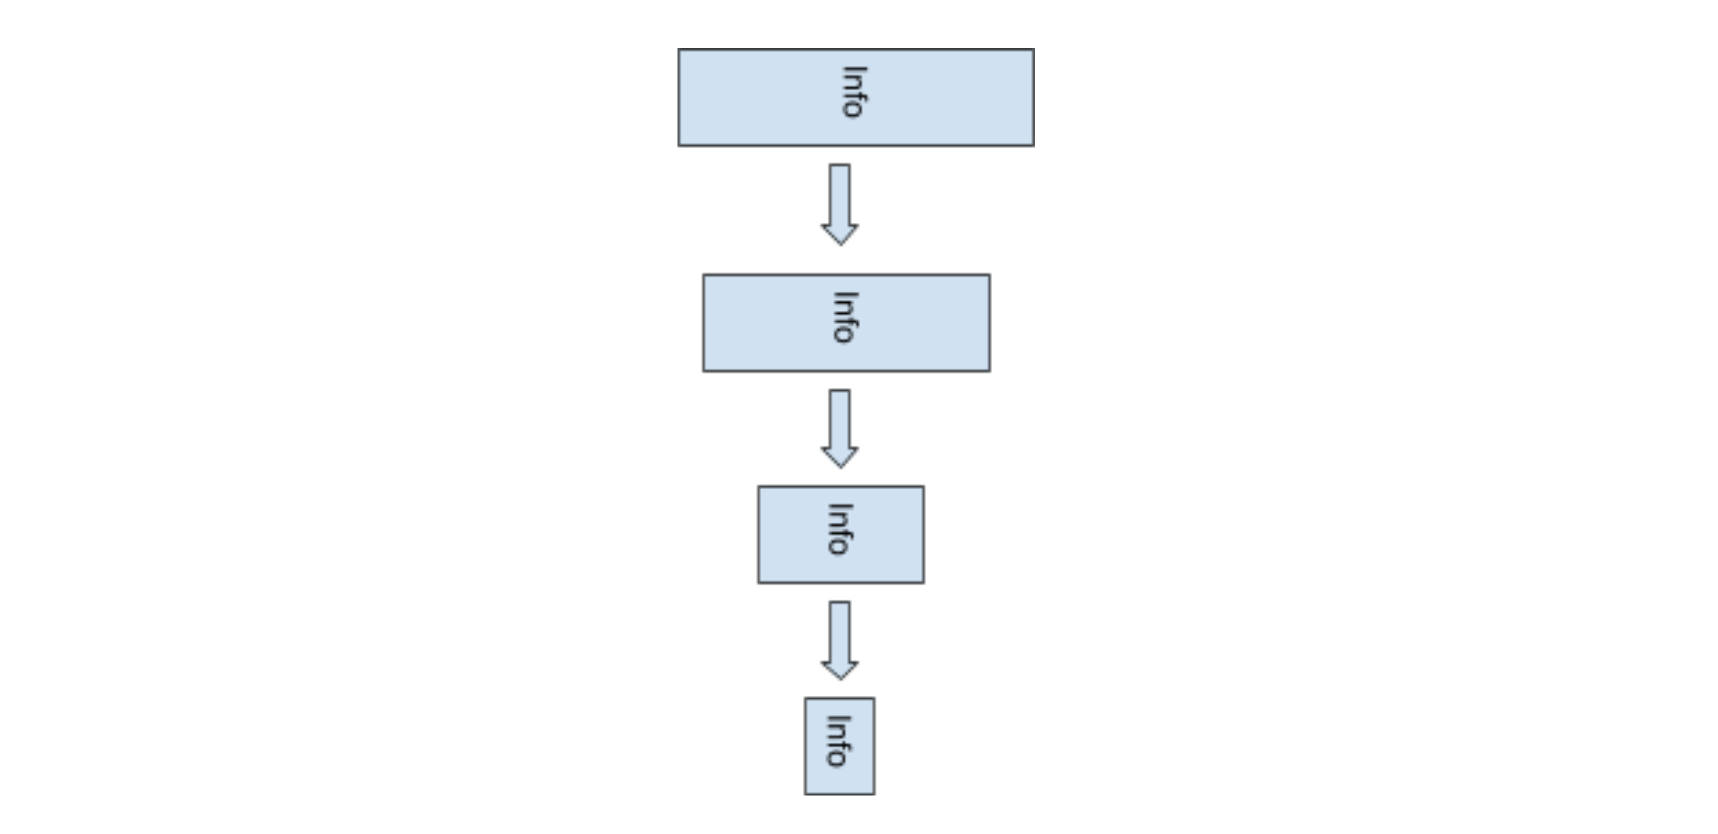
I call this presentation style Funnel Down and it is a common style data professionals use in their early careers because data professionals often think about data first, and are comfortable leading a conversation by addressing data first.
As humans, it takes us time to process numbers, statistics, and analytic techniques being presented to us (there’s a lot of information being presented) to come to the conclusion of the thought: this is also known as adding a high amount of cognitive load to our minds.
Therefore, assume that presenting numbers, statistics, and data takes more time to process.
This style is good to use when presenting to technical audiences where the focus is on the data and the techniques themselves. If you are presenting to technical folks with the goal of improving an analytic or engineering practice, this is the style you should use.
However if you plan to present analytic results to a non-technical audience with the goal of making business decisions, you switch your style.
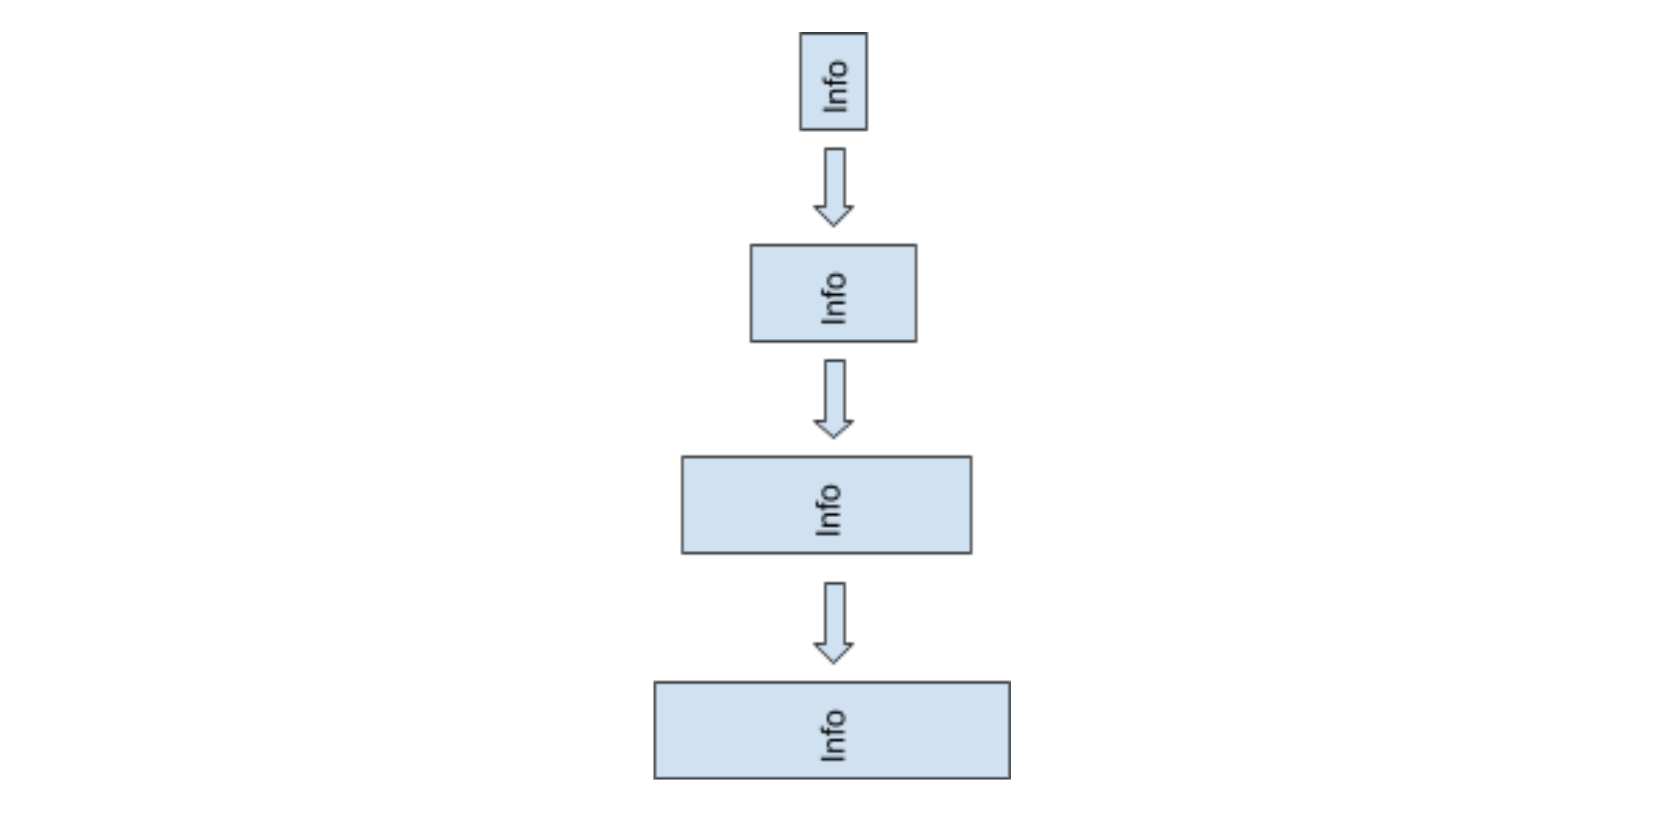
Funnel Up
If we flip the Funnel Down model, we get the Funnel Up approach where the results of the analysis and insights come up first in the presentation. This involves adding an executive summary at the beginning of the entire presentation and leading with the big insight at the beginning of every slide.
Since we are presenting the insight from our analysis first, this information is very quick to process, adding a low cognitive load to your audience. From understanding the conclusion first, they can now focus more of their attention on you, your story and how you came up to the conclusion.
This is the first step into influencing the entire business: you make sure people focus their attention on you and your story instead of the details; non-technical audiences want to quickly learn the results so they can apply the learnings towards future business decisions.
Running Through An Example
Let’s run through an example of Funnel Down vs Funnel Up.
Assume you are presenting an analysis to a non-technical audience. The presentation aims to share results of a local Marketing campaign where the learnings will help make future decisions for a national Marketing campaign using similar Marketing tactics.
Assume now that we want to present this information that shows sales results across different paid media vendors (Instagram, Snapchat, and TikTok) over the length of the entire 4-week campaign.
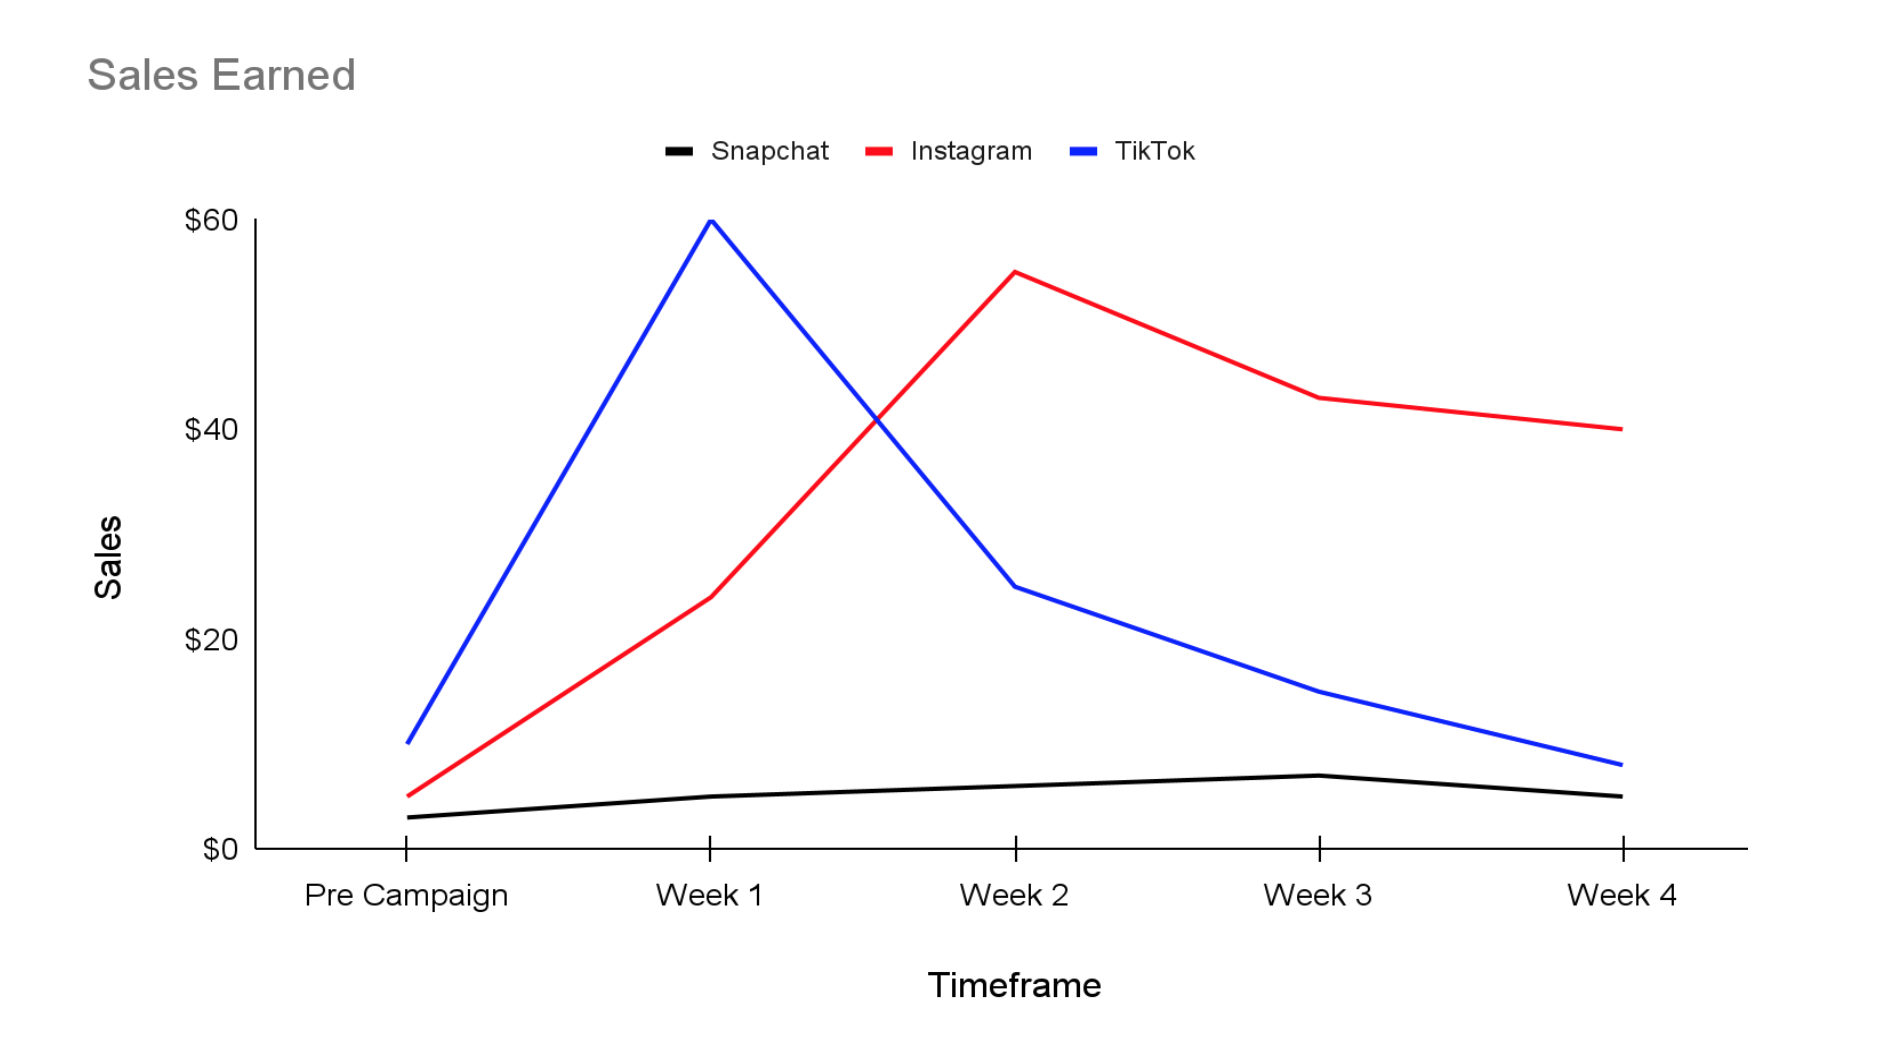
Using the Funnel Down approach, we would present this graph with the headline:
Sales from TikTok peaked at $60 in the first week while Instagram peaked at $56, with Snapchat making insignificant sales during the campaign. These results suggest that TikTok is most effective in the first week while Instagram takes two weeks to build a sustained momentum.
As you read this headline, take note how much cognitive load was put on your brain in comprehending the first sentence while reading the graph. We then end the headline with the insight that TikTok performs well in the first week, but not subsequent weeks.
Now let’s rewrite the headline using the Funnel Up approach. This technique is simple, but makes a HUGE difference in reducing the cognitive load for your audience so they can focus on you and your narration rather than the data itself.
You simply reverse the sentences and present your insights first, followed by details.
TikTok performs well in the first week and quickly dies out (peak $60 @ Week 1) while Instagram can help sustain the campaign’s momentum following Tiktok (peak $56 @ Week 2). Suggest to invest 80% of Week 1 budget to TikTok and shift remainder of TikTok budget to Instagram for subsequent weeks.
As you read that headline, notice the lower cognitive load you experienced vs the cognitive load you experienced in the Funnel Down approach. The headline was much easier to understand by bringing the insights up front first. Lead with the point of the slide first and people will have a much easier time following you, your data, and your narration.
Summary
Once you have people hooked with your insights, people can focus on you and your narration instead of trying to make sense of the data. Remember this: data is used as a tool to aid your narration.
For non-technical audiences, use the Funnel Up approach to make sure your audience focuses on you and your insights; this is the first step in improving your influence.
The last step revolves around leading your audience to the same conclusions you’ve made with each new insight you bring to the audience. This will be covered in Part II.